Air pollution causes an estimated 7.9 million premature deaths annually, making accurate forecasting a critical public health priority. Machine learning is increasingly being applied to forecast air pollution levels, yet existing benchmarks remain narrow in both geographic scope and pollutant coverage, and fail to evaluate the latest generation of time series foundation models (TSFMs) on real-world, large-scale data.
To bridge this gap, we introduce the Air Quality Arena (AQA) platform, incorporating the large-scale AQA-Data repository and the standard AQA-Bench framework. The platform covers 6 major pollutants (PM2.5, PM10, NO2, SO2, CO, and O3) over a three-year period (July 2022 - June 2025) across 7 diverse countries and 4 continents, compiling more than 14,000 station-pollutant series.
We benchmark this dataset across 11 leading time series foundation models, 4 ML/DL Models and 2 Classical Baselines to evaluate performance on short-term air quality forecasting. Our framework directly tests whether pretrained zero-shot foundation models can successfully compete with localized models optimized specifically on target stream metrics.
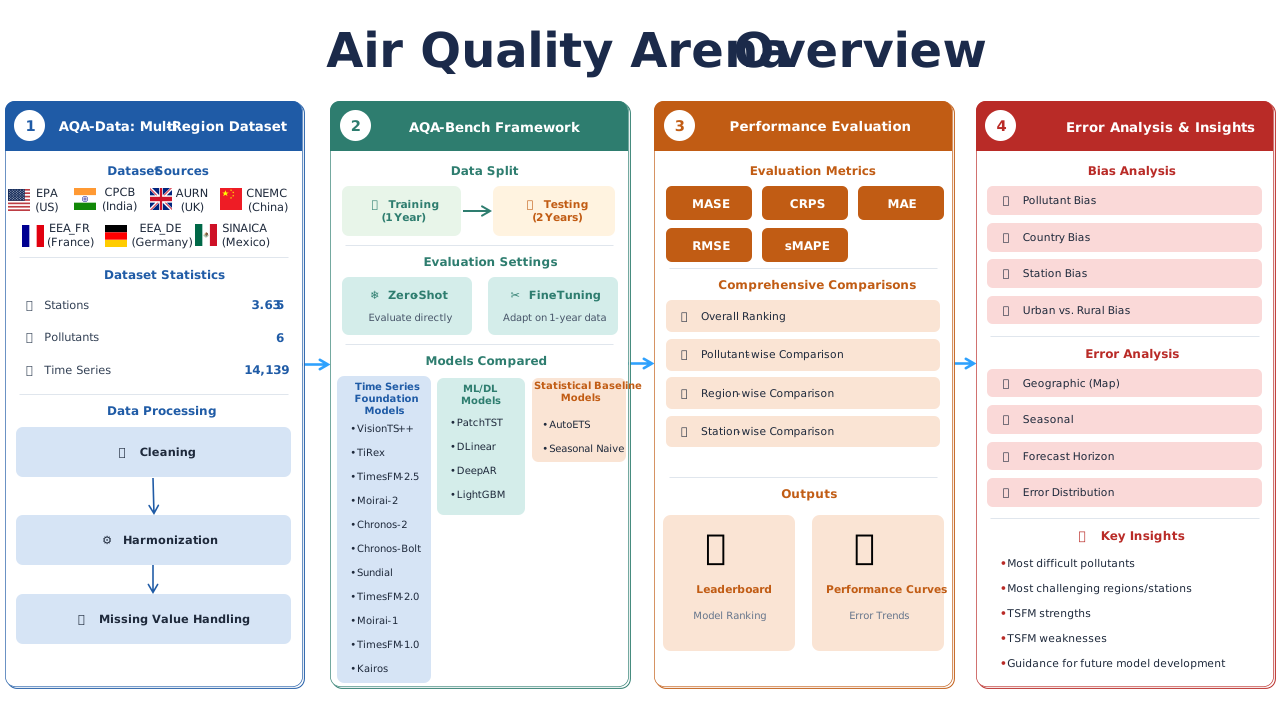
Real-World Datasets Curation: Raw granular observations are curated directly from 6 primary regulatory networks: EPA (US), CPCB (India), AURN (UK), CNEMC (China), EEA (France/Germany), and SINAICA (Mexico).
Table 1. Number of monitoring sites per pollutant and dataset in AQA-Data.
1. Strict Continuity Preprocessing: Monitored streams retain at least 70% integrity with no gaps larger than two weeks. Missing temporal points are resolved via Multiple Seasonal-Trend decomposition using LOESS (MSTL).
2. Standardized Task Setup: Formulated in a strictly univariate setting using a 168-hour context window to predict a rolling 24-hour target timeline.
Overall model performance on AQA-Bench across regions and variables. Results are normalized by the Seasonal Naive baseline.
Table 2. Overall platform micro-averages across all networks and target pollutants.
Table 3. Normalized MASE scores disaggregated by 7 country tracking streams.
Table 4. Normalized MASE scores disaggregated by 6 major atmospheric pollutant profiles.
Table 5. Normalized CRPS scores disaggregated by 7 country tracking streams.
Table 6. Normalized CRPS scores disaggregated by 6 major atmospheric pollutant profiles.
Finding 1. Multi-modal Cross-Architectures Lead the Standings.
VisionTS++ achieves top standings by treating charts as visual vectors using pre-trained computer vision encoders.
Finding 2. Zero-Shot TSFMs Consistently Beat Local Track Customizations.
Pretrained zero-shot time series foundation models beat classical networks without requiring localized optimization loops.
Finding 3. Distributional Severity Demands Global Benchmark Diversity.
Highly polluted ecosystems (like CPCB India) reveal critical performance drops hidden by clean, low-emission datasets.
@article{bharadwaj2026air,
  title={Air Quality Arena: A Unified Platform for Ground Monitoring Data, Analytics, Benchmarking, and Foundation Models},
  author={Bharadwaj, Rishi and Gupta, Manik and Arjunan, Pandarasamy},
  journal={arXiv preprint},
  year={2026}
}